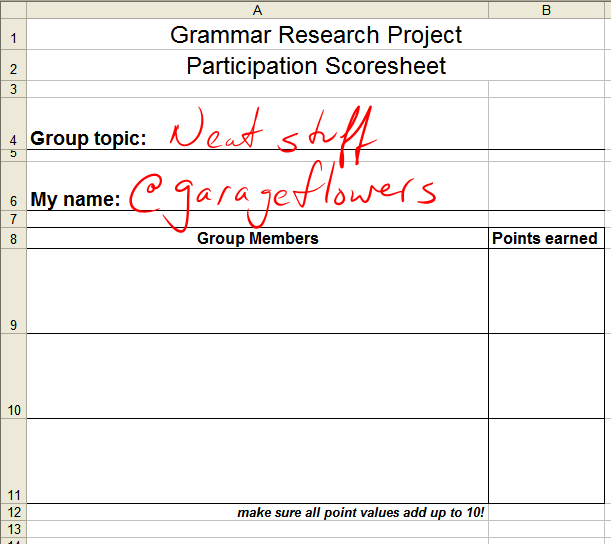
My dilemma: I love collaborative group work – I think there’s potentially a great deal of value in group projects – but I can’t always trust my students to all contribute equally. I’ve tried assigning specific roles, I’ve tried having kids sign “Equal Distribution Agreements” in which they promise to share the workload equally, and I’ve tried having kids write me reflective letters outlining their contributions and how evenly they felt work was distributed. They were all effective to a degree, but I never felt they were quite quantitative enough to justify any grade I could come up with, especially when there are conflicting reports among group members (he said, she said, etc.). I finally tried something with my most recent group project that I think worked out very well: it’s data-driven, AND it is supported by my personal observations throughout the project. Upon completion of our most recent group project, I had students fill out the following information on a half-sheet of paper (download at end of post). Above the grid, they filled in their group topic and their name. In the grid, they put every OTHER group member’s name, one to a box.
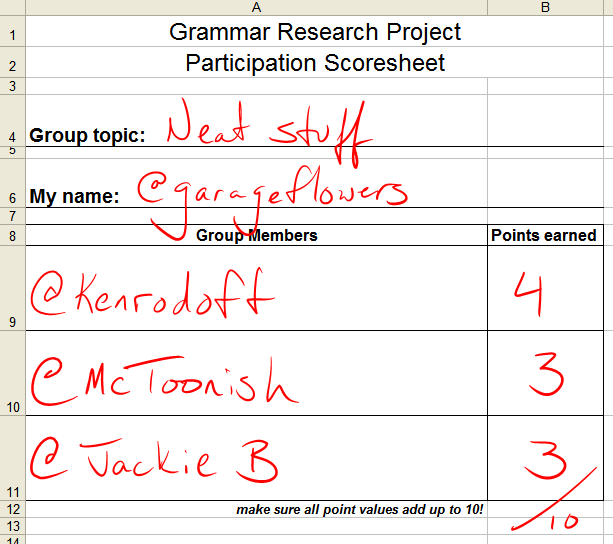
I then told the students that they each had 10 points to distribute among their group members, based on their individual contributions to the overall project. In a four-person group (three being rated), a fairly equal distribution of points would look like this:
If one person contributed much more than others, or if one person did not contribute as much to the group, it might look like this:
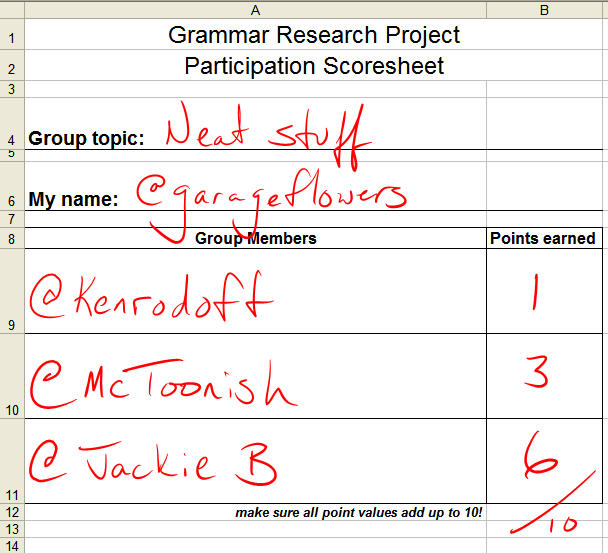
In any event, all points should add up to ten (I told them to keep their ratings whole numbers; what do I look like, a mathemagician?). In a group of 4 where work was evenly shared, a student should score anywhere between 9-12 (let’s call it 8-12 for a group of 3 or 5). To me, that’s worth an A; drop a letter grade for every point below that minimum “equal participation threshold.” It’s with that in mind that I developed the following chart:
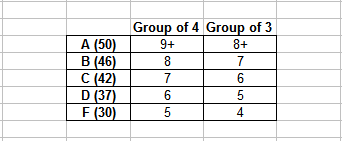
I listed the kids in a spreadsheet along with the points they earned from their group members. Add the numbers up horizontally, refer to grade equivalency chart, and assign grade.
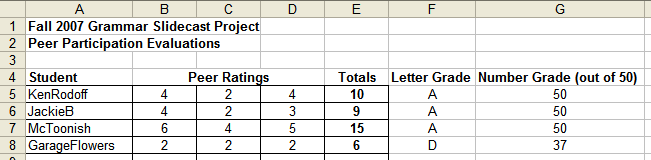
Having multiple raters for each student reduces the chances that one will suffer due to one vindictive student. KenRodoff and JackieB in the above example were each given a 2 by one of their group members, but the other ratings counteracted the one low rating and brought them both into A range.
These data also support my personal observations throughout the project. Prior to administering the survey, it seemed to me that the workload was pretty equitable, with only a few students here or there not carrying their weight. The final grade distribution for this assessment was as follows:
A: 19
B: 2
C: 1
D: 1
F: 1
Yeah, that sounds about right. I’m not concerned about the lack of a bell curve because I would rather see 79% of my students truly working collaboratively than have a majority of the class do a so-so job.
It’s not perfect, but it’s by far the most objective, data-driven approach to grading participation I’ve ever taken. I can’t take full credit for this, as I distinctly remember getting the basis for this from someone in the Twitterverse (sorry, can’t remember who), but I did flesh it out to suit my needs.
I’ll definitely be trying this again soon. As much as I love the fact that most of the work was spread around equally, part of me would like to see if the data clearly supports my observations when multiple students don’t participate.
Assessing individual contributions to large group projects has always been difficult for me, but I think I’ve got something that works now. Please feel free to download any of my materials for use with your students, and leave a comment – how do you assess individual contributions to group work? Are there any significant drawbacks to this method I might have missed?
Peer Evaluation Sheet (2 to a page) (.xls)
Peer Participation Data Entry Sheet (.xls)